JMeter
JMeter is a load testing tool which helps you to analyse the performance and scalability a web application. It does so by simulating multiple concurrent users browsing the web application. This way you are not only able to estimate the numbers of users your web application can handle, but also where bottlenecks are and perhaps how to fix them. For that reason JMeter is usually used in addition with other monitoring tools and profilers such as tideways, for example.
Shopware JMeter Scripts
Load testing is a common requirement in e-commerce projects, especially when challenging performance requirements needs to be addressed. For that reason Shopware provides a basic set of JMeter scripts for Enterprise customers, in order to be able to estimate the scalability of the system before going live.
Setup
In order to use the Shopware JMeter Scripts you need to run Linux / Mac and have a recent version of Java installed. The Shopware JMeter Scripts are available on github(access on request). First clone the repository:
git clone git@gitlab.com:shopware/shopware/enterprise/jmeter.git
No you'll find the following directories:
assets: The Shopware JMeter Scripts will generate testing assets in hereconfig: JMeter configurationscripts: Scripts to generate the required assets and run / edit JMetervar: Logs and result filesvendor: JMeter itself
Editing the test plan
In order to edit the test plans, just run ./scripts/jm-edit.sh. It will open the JMeter application. The Shopware
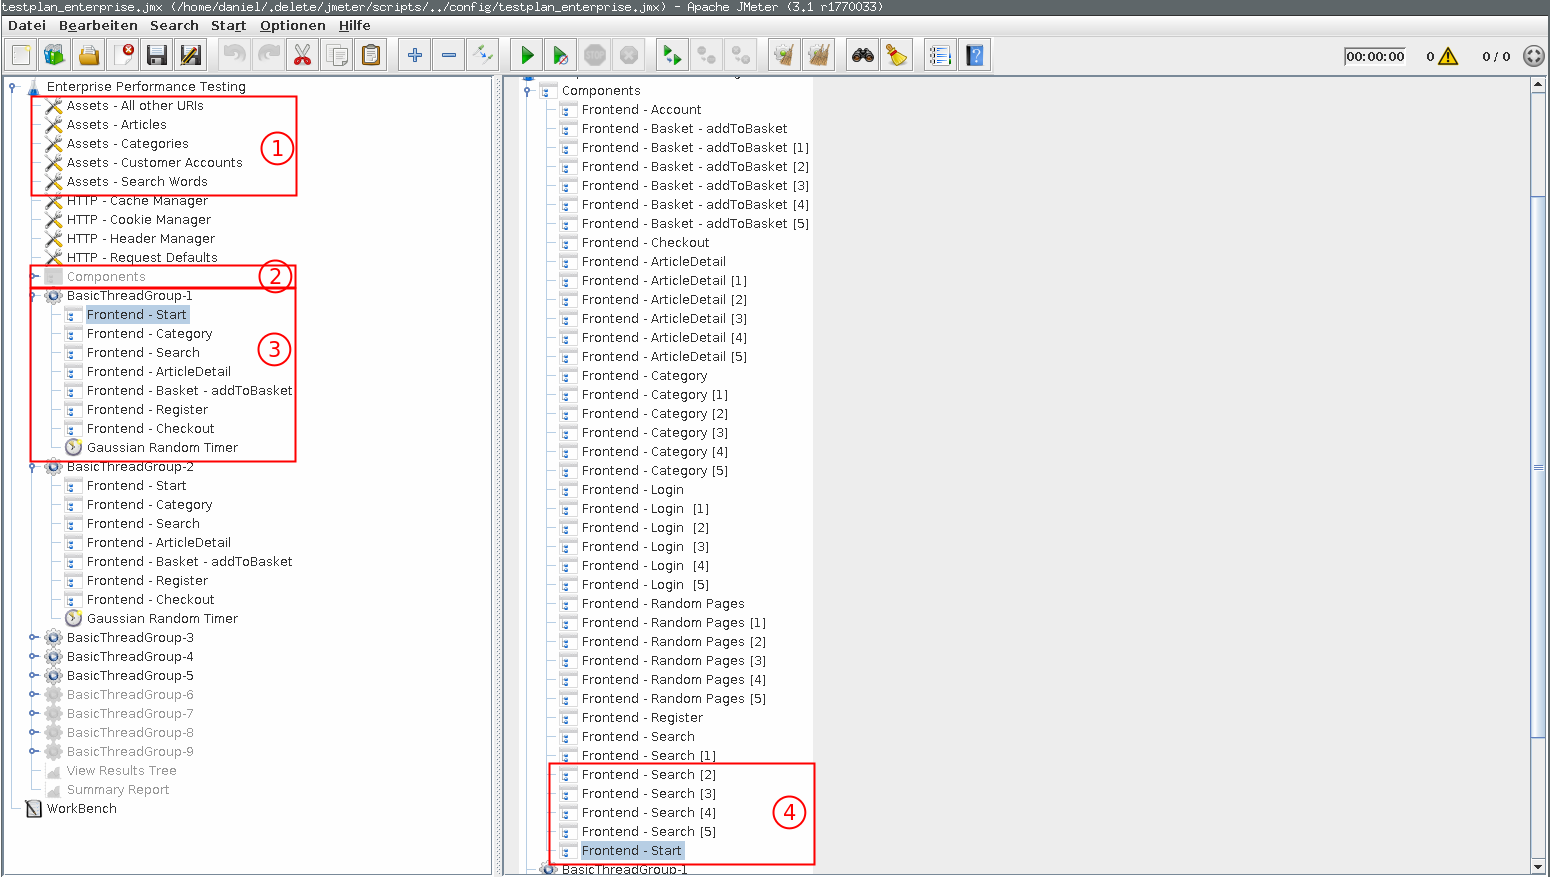
JMeter Scripts generally defines 9 different components (2) you can use in your test plans:
Frontend - Start: A call to the start pageFrontend - Category: A call to a random category pageFrontend - Search: Performs a random searchFrontend - Random: A request to a random static pageFrontend - addToBasket: Add a product to the shopping cartFrontend - ArticleDetail: A call to a random product detail pageFrontend - Register: Registers a new customerFrontend - Login: Logs in as an existing customerFrontend - Checkout: Calls the checkout confirm and the checkout finish page (thus performs an order)
Most of these components use certain assets (1): For the Frontend - Category component, for example, a random category URL is required -
and provided by the corresponding asset.
The actual test plans are defined in so called "thread groups": Each thread group copies or links one or more components and therefor "tells a user story" such as "a user visits the start page, searches for 5 items and then adds two items to cart" or "a user browses 3 categories, adds 1 item to cart, registers and performs an order". This way you can try to model real user's behaviour in your test plans. In production, for example, just 3 to 5% of your users will actually perform a checkout. So it makes sense to create one thread group only browsing the shop and one thread group which actually performs checkouts.
The Shopware JMeter Scripts define 9 thread groups which you can change to your needs: E.g. one group for users mostly searching, one group for users mostly browsing, one group for registered users and one group for users not yet registered. Copy / link the pre-defined components into each thread group as needed. After saving you can close the window again and configure, how many threads / users are active for each thread group.
Test plan configuration
First edit the file config/testplan_config.properties. By default it will look like this:
server.hostname = shopware.local
server.protocol = http

execution.delay = 10000

execution.deviation = 5000

execution.rampup = 30

execution.duration = 120

threads.group_1.users = 100
threads.group_2.users = 3
threads.group_3.users = 0
threads.group_4.users = 0
threads.group_5.users = 0
threads.group_6.users = 0
threads.group_7.users = 0
threads.group_8.users = 0
threads.group_9.users = 0
server.hostname: Hostname of the server you want to load test, e.g.my-production-shop.example.comserver.protocol: The protocol you want to use, usuallyhttporhttpsexecution.delay: How many ms should pass between each action of a thread groupexecution.deviation: Theexecution.delaywill randomly be increased / reduced byexecution.deviationexecution.rampup: JMeter will take up toexecution.rampupseconds until all threads are startedexecution.duration: Number of seconds the load test should runthreads.group_NUMER.users: Number of concurrent users you want to simulate for a thread group
The above configuration, for example, will run for 2 minutes and spawn 100 threads ("users") for the first thread group and 3 threads ("users") for the second thread group. Between each request of a thread ("user") a 10 second delay is defined.
Generating the assets
In order to run JMeter some assets needs to be generated, so that JMeter knows which URLs to call and which products
to buy. All assets are generated directly from Shopware's database. For that reason, you need to specify your database
credentials in scripts/credentials.sh. A template for that file can be found in scripts/credentials.dist.sh.
Furthermore you need to specify SHOP_USER_PASSWORD: JMeter will use this password when logging in as a user. If you are
load testing an existing database dump, you will usually need to set the passwords in the database:
UPDATE s_user SET password="$2y$10$PeSQ3o7F0hocHKH.1CvUCexZ/qernZ4wUC4cbGj2a3jLgLCcvwMRm"
This will set all passwords to "shopware". JMeter will now be able to log in as any of these users. As an alternative you can also generate dummy data automatically by using the Shopware CLI tools.
In order to generate all assets, just run ./scripts/all-uris.sh. If you just want to (re-)generate a part of the assets,
there are specific scripts such as scripts/uri-accounts.sh or scripts/uri-search.sh.
Running the load test and inspecting the results
In order to execute the load test, just run scripts/jm-run.sh. It will execute the test plan for the configured
execution.duration:
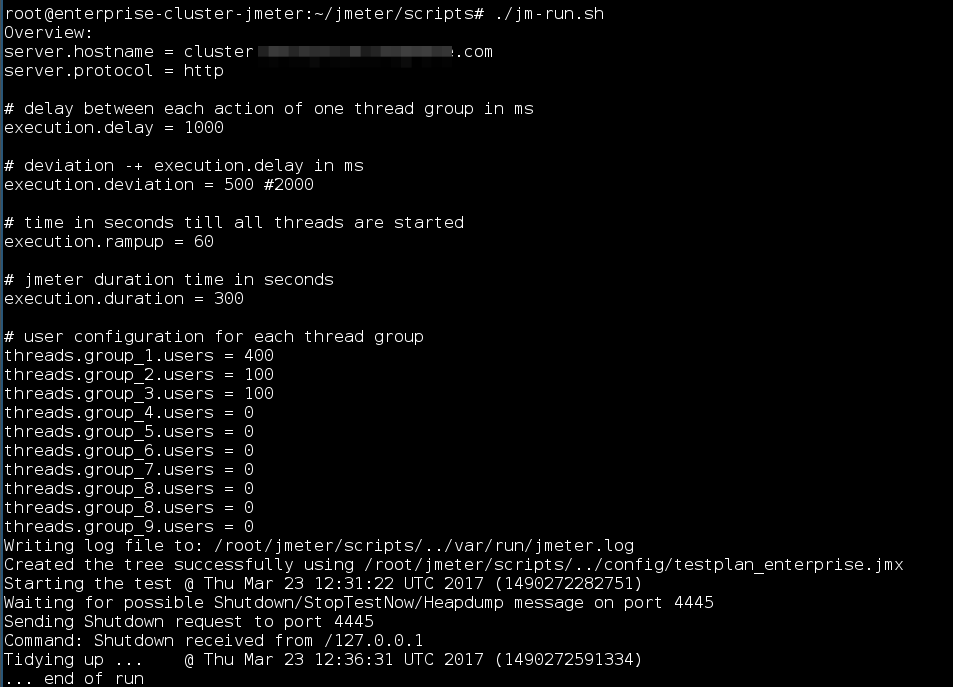
While the test plans run, its usually helpful to watch the load of the application servers and the database: If disc load, RAM usage or CPU usage are extremely high, you might have found a bottleneck. But also keep in mind, that the number of connections can be a limiting factor for all of these servers.
After the test plan exited, you can run ./scripts/jm-edit.sh again in order to open JMeter. At the bottom of the navigation
on the left side you find "Summary Report" (1). Click on it and open the CSV file of your JMeter run (2):
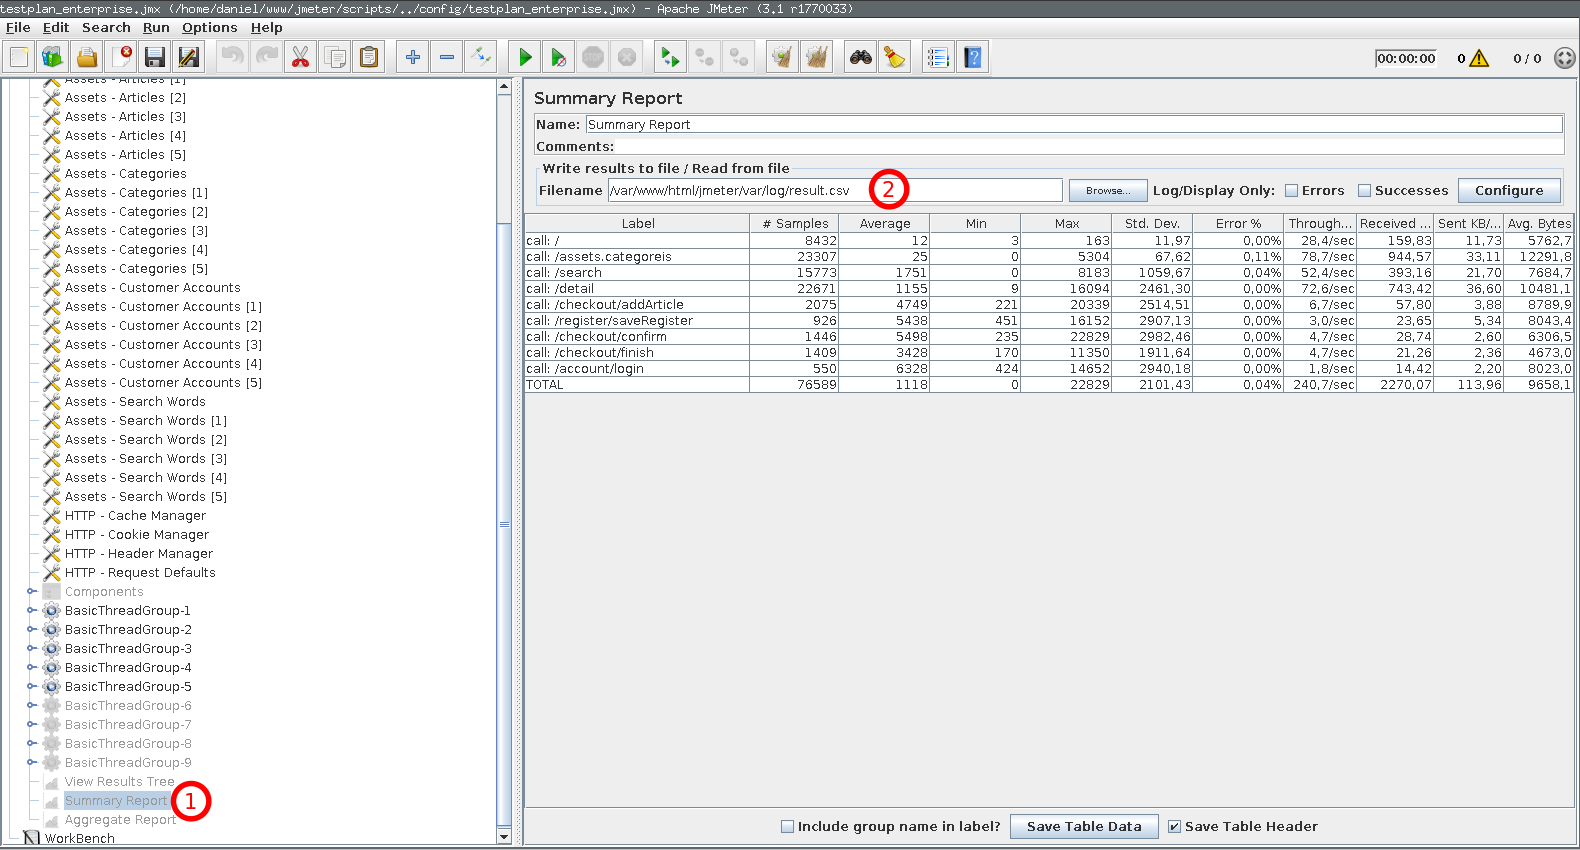
JMeter will present you all URLs which have been called, the average response time, number of samples, percentage of
errors and other useful metrics. You can even inspect every single request by selecting "View Result Tree" from the
navigation. After opening the result.csv file, JMeter will show you every request with the corresponding headers and
body. This is especially useful, if you want to debug errors.