Debugging Shopware
Writing and extending software is only a part of a developer's daily work. Debugging and bug fixing is another relevant part one needs to take care of. So what should you do if something does not work as it is supposed to?
Default log output
First you should check if Shopware already logged the error message you are looking for.
For that reason you should check the webserver's error.log file, as well as Shopware's logs directory.
Shopware creates a log file per day (if there was something to log).
As Shopware frequently uses AJAX queries in the frontend and backend, you should also open an instance of your browser's developer tools. You might find error messages in the Javascript console or in the network tab.
By default, Shopware hides exceptions from your customers, in order to not expose private and/or technical data.
If you are experiencing problems with your shop installation, you might want to re-enable the error output while debugging,
by pasting this snippet into your config.php file:
[
    'db' => [
        // your database configuration
    ],
    'front' => [
        'showException' => true
    ],
    'phpsettings' => [
        'display_errors' => 1,
    ],
]
PHP
Xdebug
Xdebug is a very common and convenient way to debug your PHP applications. It will allow you to debug a request step by step and inspect variables and object values at any point.
It can be found in all common linux distributions, e.g. in Ubuntu as php-xdebug.
After installing the extension, you will need to configure the xdebug php extension,
e.g. in the file /etc/php/7.4/apache2/conf.d/20-xdebug.ini (this might vary depending on your distribution and PHP setup).
Using a local setup, your configuration might look like this:
zend_extension=xdebug.so

xdebug.remote_enable=on
xdebug.remote_host=127.0.0.1
xdebug.remote_port=9000
xdebug.idekey=PhpStorm
After restarting the web server, Xdebug should already be available. Now you should set up Xdebug in your IDE, (e.g. PhpStorm). In order to comfortably switch Xdebug on and off, you might use a browser extension like Xdebug helper for chrome. Equivalent extensions exist for other browsers. Should your browser not have or support these extensions, you might still use Xdebug by appending a specific query argument to your URL. PhpStorm will do this automatically for you if you configure the debug environment, but this feature is not exclusive to this IDE. Refer to Xdebug and your IDE's documentation for more info on this feature.
This might be very useful, as Xdebug might reduce the overall performance of your request.
If you are debugging a CLI command, you can also use Xdebug.
Use export XDEBUG_CONFIG="idekey=PHPSTORM" prior to running your PHP CLI command and make sure that PhpStorm is listening for Xdebug connections.
Again, this feature is not exclusive to PhpStorm, and might be supported in other IDEs.
Monolog
Shopware makes use of the Monolog logger, which allows you to log into files, databases, emails or FirePHP.
By default, a CoreLogger and a PluginLogger are set up for usage:
Shopware()->Container()->get('pluginlogger')->info("my info");
Shopware()->Container()->get('pluginlogger')->warning("my warning");
Shopware()->Container()->get('pluginlogger')->error("my error");
These calls will render the messages "my info", "my warning" and "my error" to the file logs/plugin_production-YYY-MM-DD.log.
Depending on the logger configuration, you could force monolog to only show info messages if a warning or error occurs later (two fingers crossed handler),
which might also be a huge benefit in productive environments.
If multiple plugins write to the "PluginLogger", creating own loggers with other persistence backends is also an option.
error_log
Setting up Xdebug might not always be possible (e.g. you don't have full admin access over a server) or appropriate for a quick output check.
The error_log function is useful in those cases.
It allows you to write output to the webserver's error log file:
error_log('Hello world');
In addition to that, error_log also allows you to define a file to write to.
If you don't have access to the server's log file, or you don't want to spam it with debug messages, this call might be useful to you:
error_log(print_r(array('hello', 'world'), true)."\n", 3, Shopware()->DocPath() . '/error.log');
This will write the content of the array array('hello', 'world') properly into the error.log file in your Shopware directory.
In addition to that, you can use the linux tail command to constantly print out new lines written to that file:
tail -f error.log
Debugging complex objects / Doctrine
Dumping complex object trees (such as Doctrine models) might cause your browser or server to freeze. For this reason, things like this will not work in most cases:
// bad example
echo "<pre>";
print_r(Shopware()->Shop());
exit();
Instead, you should use the Doctrine debug helper to print / log complex objects:
$result = \Doctrine\Common\Util\Debug::dump(Shopware()->Shop(), 2, true, false);
// now safely log $result with your preferred logger
shopware-profiler
The FroshProfiler is a plugin that adds a developer toolbar to your shop and provides some useful debugging features as: * showing registered and called events * viewing of database operations and their results * providing various template information such as variables and which files were loaded
Special thanks go to Soner Sayakci (@Shyim97 on Twitter) who wrote and maintains this plugin.
Frontend templates
Writing frontend templates will confront you with questions like "what was that variable's name again?" or "which key holds the price?".
Smarty
For this kind of questions, Smarty offers the handy {debug} tag.
You can just put it in any template block of your plugin's template, or even the core template (it's just temporary).
You should just make sure that the block you are putting it into is actually rendered.
In this example, the {debug} tag was put in the themes/Frontend/Bare/frontend/index/index.tpl file, inside the frontend_index_html block.
{block name='frontend_index_html'}
{debug}
// rest of the block
{/block}
After clearing the cache and refreshing the page, Smarty will generate a new window like this:
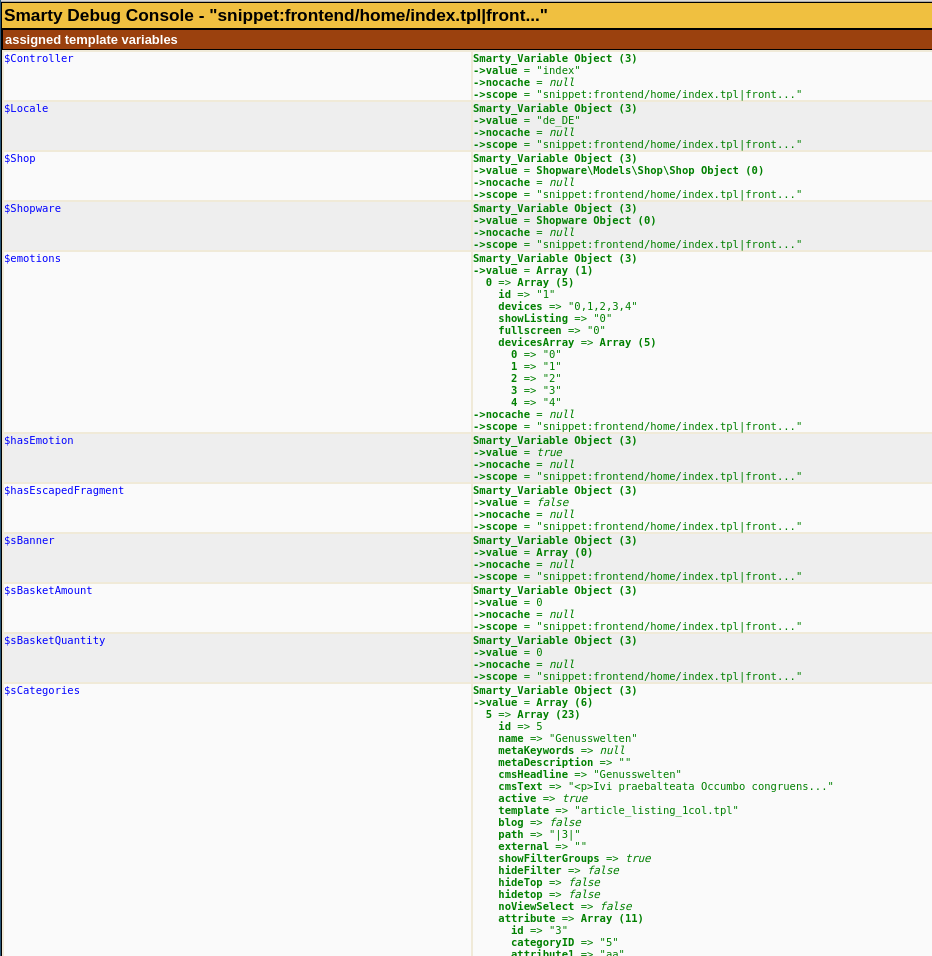
As you can see, you have a nice overview of all variables and assignments.
Debug Plugin
Shopware also ships with a plugin called "debug" which will allow you to print out template assignments to the console tab of your developer tools window.
Just install the plugin using Shopware's plugin manager, configure it to your needs and reload the page.
As you can restrict the plugin to your own IP address, this is also suitable for production environments.
ExtJS
Debugging ExtJS errors during development can be very time-consuming.
Errors like c is not a constructor are often not helpful.
To address this, you can include ext-all-dev.js instead of the default ext-all.js file.
Add the following part to your config.php file.
[
    // ...
    'extjs' => [
        'developer_mode' => true,
    ],
    // ...
]
After clearing the cache and reloading the backend, the "development" ExtJS file is included, which displays more helpful error messages.
In many cases, you will have no alternative but to debug using console.log() calls in your Javascript code.
The following list should help you narrow down the error:
- Invalid class names: The name of your ExtJS class (in the
definecall) must match your directory path. E.g.Resources/views/backend/my_plugin/view/windowshould beShopware.apps.MyPlugin.view.Window - Referencing a wrong xtype: Whenever you use
xtypeto reference a ExtJS class, you should double-check if the referenced xtype actually exists. - Not registering the components: As ExtJS must actually know your components, you need to either register them in the
app.jsfile or (when extending pre-existing modules) include them using Smarty and extending the original applicationsapp.jsblock. - Missing call to
callParent(arguments);: When implementing your own components in ExtJS, you will overwrite base-components a lot. When you are implementing a constructor likeinitComponentorinityou should callcallParent(arguments);so that ExtJS can handle the base component's logic. - Smarty errors: Remember that Smarty parses the Javascript backend files. For that reason, Javascript objects always need to have whitespaces before and after the opening and closing curly brace. This also applies for your comments! So if your IDE generates a DocBlock like this:
// bad example
/**
*
* @returns {Array}
*/
function: test() {
    return [];
}
Smarty will try to parse the snippet {Array} and raise an exception, as this is not a valid Smarty tag.
The same applies for objects like this:
// bad example
fields = [
    {name:"test"},
    {name:"another test"},
]
A correct example might look like this:
// good example
fields = [
    { name: "test" },
    { name: "another test" },
]